The S&P500 is embedded in bear market territory and there is a deafening crescendo of negative rhetoric about generational inflation highs and a looming recession.
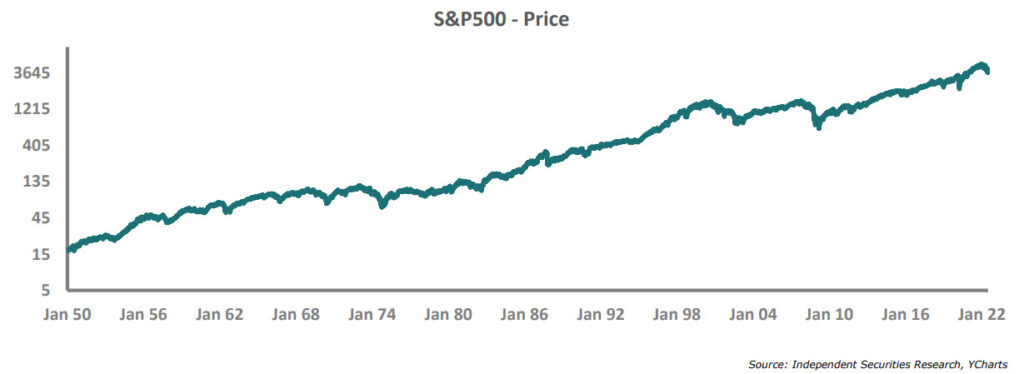
The interesting thing about bear markets is that every single one of them has ended with the market recovering to new highs.
The bare truth is that every single bear market has ended with a BULL market. That is the inherent nature of cycles. This bear market will be no different than the 19 before it and will end with positive returns for investors. Bear markets are an undeniable characteristic of long-term investing, and every investor will experience around 8.5 bear markets during their investing lifetime. Global equity investors have historically doubled their money every 9 years for a century, even though there have consistently been significant negative macro events like recessions, wars, inflationary spirals, excessive leverage and bear markets.
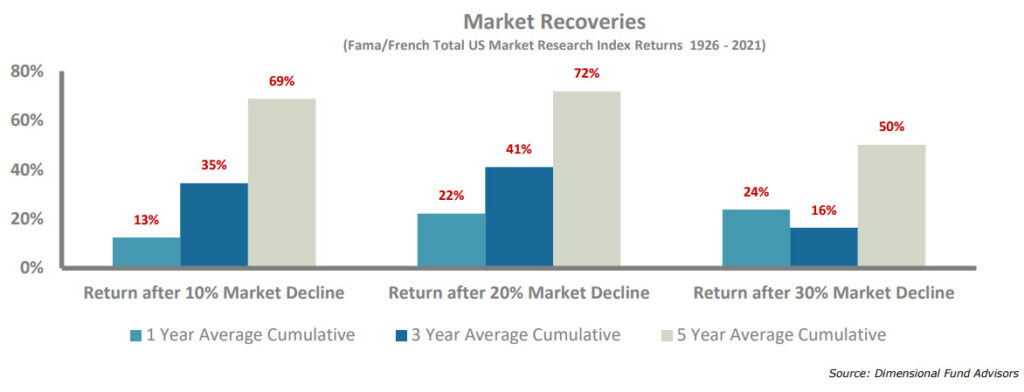
There is also strong empirical evidence showing that the 1/3/5-year returns after the market enters a bear market is a rewarding period for equity investors. In other words, it has paid handsomely to invest when equity markets are at their darkest moment and confidence at its worst. We are possibly quite close to this point as the Bank of America Bull & Bear Indicator is at 0, reflecting wholesale investor apathy towards equities. This indicator was at the same reading at the depth of the global financial crisis, euro debt crisis and covid crisis.
It may be tempting to time the bottom of this bear market but history has shown us that the market will move strongly long before any official data marking an improvement, is announced. This is because most economic data series are lagging indicators. The folly of market timing was demonstrated in the recoveries after the covid and global financial crisis market crashes when markets recovered aggressively even though the actual news flow was still very negative.
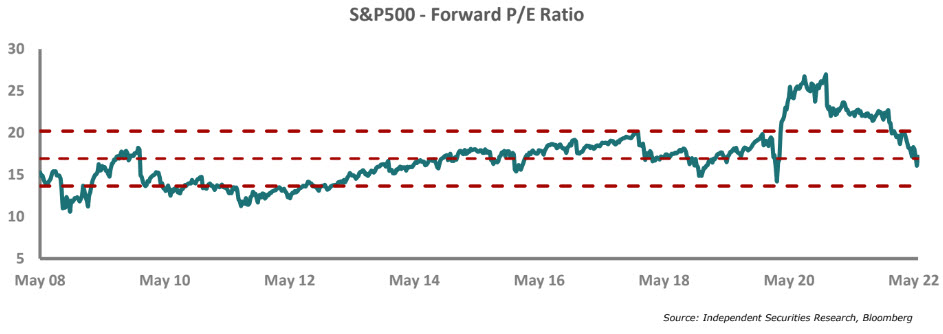
Without a doubt, the second-quarter earnings reports for US companies will not be good because of higher US interest rates, the Ukrainian war, high inflation and the rolling Chinese covid lockdowns. But everyone knows this and arguably is already reflected in prices. The valuation level of the S&P500 has contracted significantly and it is now difficult to argue that this index is expensive when it is trading in line with its long-term average. Furthermore, the contraction of the price/earnings ratio (P/E ratio) of the S&P500 has been the fastest in history, which means the index, and underlying companies, have become much cheaper. A P/E ratio is a short-hand valuation measurement and expresses how many years of profits it would take to pay off the share price of company. The S&P500’s P/E ratio has ranged between 10-25 historically and this level is a function of the prevailing sentiment, growth prospects, interest rates and general economic conditions.
We encourage investors to maintain their strategic financial plan and retain their equity exposure as this still offers the best asset class opportunity to generate real long-term investment returns.

Research Editor
Simon Fillmore
Michele Santangelo